Any reference to population refers to Estimated Resident Population (ERP).
Any reference to capital city refers to Greater Capital City Statistical Area (GCCSA), and any reference to area refers to Statistical Area Level 2 (SA2).
Statistics about the population and components of change (births, deaths, migration) for Australia's capital cities and regions
Any reference to population refers to Estimated Resident Population (ERP).
Any reference to capital city refers to Greater Capital City Statistical Area (GCCSA), and any reference to area refers to Statistical Area Level 2 (SA2).
| Capital city | ERP at 30 June 2024 | 2023-24 (no.) | 2023-24 (%) |
|---|---|---|---|
| Sydney | 5,557,233 | 107,538 | 2.0 |
| Melbourne | 5,350,705 | 142,637 | 2.7 |
| Brisbane | 2,780,063 | 72,930 | 2.7 |
| Adelaide | 1,469,163 | 22,125 | 1.5 |
| Perth | 2,384,371 | 72,742 | 3.1 |
| Hobart | 254,930 | 946 | 0.4 |
| Darwin | 152,489 | 1,367 | 0.9 |
| Canberra | 473,855 | 7,496 | 1.6 |
| Total capital cities | 18,422,809 | 427,781 | 2.4 |
Population change at the regional level has three components: natural increase, internal migration and overseas migration.
| Capital city | Natural increase | Internal migration | Overseas migration |
|---|---|---|---|
| Sydney | 27,738 | -41,086 | 120,886 |
| Melbourne | 28,978 | -7,581 | 121,240 |
| Brisbane | 13,104 | 15,567 | 44,259 |
| Adelaide | 3,758 | -3,323 | 21,690 |
| Perth | 11,250 | 8,078 | 53,414 |
| Hobart | 462 | -2,000 | 2,484 |
| Darwin | 1,378 | -2,751 | 2,740 |
| Canberra | 2,800 | -1,550 | 6,246 |
Components of population change by capital city
["Capital city","Natural increase","Internal migration","Overseas migration"]
[["Sydney","Melbourne","Brisbane","Adelaide","Perth","Hobart","Darwin","Canberra"],[[27738],[28978],[13104],[3758],[11250],[462],[1378],[2800]],[[-41086],[-7581],[15567],[-3323],[8078],[-2000],[-2751],[-1550]],[[120886],[121240],[44259],[21690],[53414],[2484],[2740],[6246]]]
[]
[{"value":"0","axis_id":"0","axis_title":"","axis_units":"","tooltip_units":"","table_units":"","axis_min":null,"axis_max":null,"tick_interval":null,"precision":"-1","data_unit_prefix":"","data_unit_suffix":"","reverse_axis":false}][{"value":"0","axis_id":"0","axis_title":"","axis_units":"","tooltip_units":"","table_units":"","axis_min":"-50000","axis_max":"175000","tick_interval":null,"precision":"-1","data_unit_prefix":"","data_unit_suffix":"","reverse_axis":false}]The areas with the largest growth were:
The areas with the highest growth rates were:
Outside of the capital cities:
| SA2 | SA4 | ERP at 30 June 2024 | 2023-24 (no.) |
|---|---|---|---|
| Fraser Rise - Plumpton | Melbourne - West | 20,730 | 4,316 |
| Rockbank - Mount Cottrell | Melbourne - West | 31,389 | 4,145 |
| Box Hill - Nelson | Sydney - Baulkham Hills and Hawkesbury | 22,420 | 4,042 |
| Clyde North - South | Melbourne - South East | 24,609 | 3,932 |
| Marsden Park - Shanes Park | Sydney - Blacktown | 27,263 | 3,497 |
| SA2(a) | SA4 | ERP at 30 June 2024 | 2023-24 (%) |
|---|---|---|---|
| Taylor | Australian Capital Territory | 4,766 | 28.7 |
| Fraser Rise - Plumpton | Melbourne - West | 20,730 | 26.3 |
| Box Hill - Nelson | Sydney - Baulkham Hills and Hawkesbury | 22,420 | 22.0 |
| Strathnairn | Australian Capital Territory | 1,915 | 21.6 |
| Tarneit - North | Melbourne - West | 13,485 | 20.3 |
Australia's centre of population:
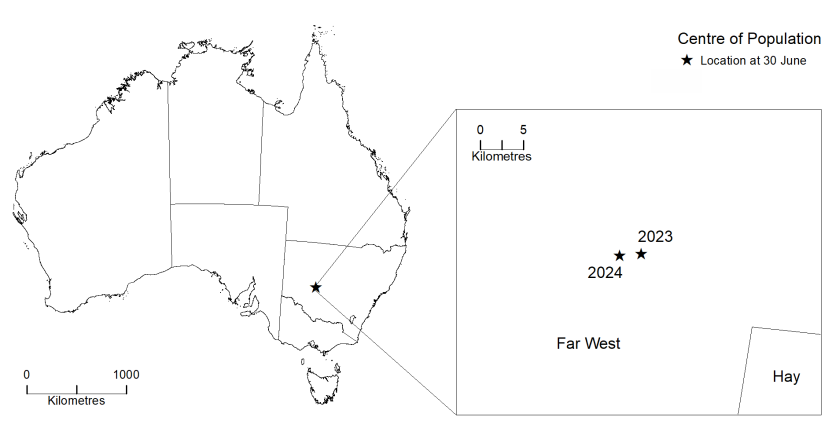
This image shows the location of Australia’s centre of population on a map of Australia. The area of the centre of population is zoomed in to an SA2 level, showing the locations of the centre of population as at 30 June 2023 and 30 June 2024. These locations are in Far West SA2, north of Hay SA2 in NSW.
Australia's population density at June 2024 was 3.5 people per square kilometre (sq km).
The most densely populated areas were:
Population density can also be explored at a finer level by breaking Australia up into 1 km² grid cells.
Grid cells can be grouped into population density classes, ranging from no population to very high.
| No population | Very low | Low | Medium | High | Very high | |
|---|---|---|---|---|---|---|
| (0)* | (Less than 500)* | (500 to less than 2000)* | (2000 to less than 5000)* | (5000 to less than 8000)* | (8000 or more)* | |
| Sydney | 6,992 | 3,478 | 791 | 910 | 136 | 58 |
| Melbourne | 2,946 | 4,861 | 1,001 | 1,127 | 53 | 16 |
| Brisbane | 6,942 | 7,607 | 803 | 473 | 20 | 4 |
| Adelaide | 546 | 1,996 | 383 | 323 | 1 | 0 |
| Perth | 2,813 | 2,424 | 676 | 498 | 3 | 0 |
| Hobart | 518 | 1,041 | 113 | 22 | 0 | 0 |
| Darwin | 2,427 | 676 | 54 | 22 | 0 | 0 |
| Canberra | 1,855 | 233 | 202 | 67 | 3 | 0 |
* people per square kilometre
Greater Sydney increased by 107,500 people (2.0%), the rest of the state increased by 30,600 (1.1%).
The areas with the largest growth were in Sydney's outer north-west:
The areas with the highest growth rates were:
While net overseas migration (120,900 people) and natural increase (27,700) were positive contributors to Greater Sydney's population increase, net internal migration was negative (-41,100).
The centre for New South Wales:
The centre for Greater Sydney:
The areas with the highest density at June 2024 were:
Greater Melbourne increased by 142,600 people (2.7%), the rest of the state increased by 19,800 (1.2%).
The areas with the largest growth were:
The areas with the highest growth rates were:
While net overseas migration (121,200 people) and natural increase (29,000) were positive contributors to Greater Melbourne's population increase, net internal migration was negative (-7,600).
The centre for Victoria:
The centre for Greater Melbourne:
The areas with the highest density at June 2024 were all in inner Melbourne:
Greater Brisbane increased by 72,900 people (2.7%), the rest of the state increased by 50,400 (1.8%).
The areas with the largest growth were:
The areas with the highest growth rates were:
Net overseas migration (44,300) people) was the largest contributor to Greater Brisbane's population increase, followed by net internal migration (15,600) and natural increase (13,100).
The centre for Queensland:
The centre for Greater Brisbane:
The areas with the highest density at June 2024 were all inner Brisbane suburbs:
Greater Adelaide increased by 22,100 people (1.5%), the rest of the state increased by 2,900 (0.7%).
The areas with the largest growth were:
The areas with the highest growth rates were:
While net overseas migration (21,700 people) and natural increase (3,800) were positive contributors to Greater Adelaide's population increase, net internal migration was negative (-3,300).
The centre for South Australia:
The centre for Greater Adelaide:
The areas with the highest density at June 2024 were all near Adelaide's central business district:
Greater Perth increased by 72,700 people (3.1%), the rest of the state increased by 8,600 (1.5%).
The areas with the largest growth were:
The areas with the highest growth rates were:
Net overseas migration (53,400 people) was the largest contributor to Greater Perth's population increase, followed by natural increase (11,300) and net internal migration (8,100).
The centre for Western Australia:
The centre for Greater Perth:
The areas with the highest density at June 2024 were:
Greater Hobart increased by 950 people (0.4%), the rest of the state increased by 810 (0.3%).
The areas with the largest growth were:
The areas with the highest growth rates were:
While net overseas migration (2,500 people) and natural increase (460) were positive contributors to Greater Hobart's population increase, net internal migration was negative (-2,000).
The centre for Tasmania:
The centre for Greater Hobart:
The areas with the highest density at June 2024 all surrounded Hobart's central business district:
Greater Darwin increased by 1,400 people (0.9%), the rest of the territory increased by 640 (0.6%).
The areas with the largest growth were:
The areas with the highest growth rates were:
While net overseas migration (2,700 people) and natural increase (1,400) were positive contributors to Greater Darwin's population increase, net internal migration was negative (-2,800).
The centre for the Northern Territory:
The centre for Greater Darwin:
The areas with the highest density at June 2024 were:
The number of people living in the Australian Capital Territory increased by 7,500 (1.6%).
The areas with the largest growth were:
The areas with the highest growth rates were:
While net overseas migration (6,200) and natural increase (2,800 people) were positive contributors to Canberra's population increase, net internal migration was negative (-1,600).
The centre for the Australian Capital Territory:
The areas with the highest density at June 2024 were:
On each map an area can be selected to view the underlying data. All data can be found in the Data downloads section of this publication.
This interactive map displays the percentage population change in Statistical Areas Level 2 (SA2s) between 2023 and 2024. Percentage of population change is divided into 5 data classes:
The top 10 growth SA2s are also displayed with blue dots.
This map shows that the SA2s with the highest population growth rates in 2023-24 were generally on the outskirts of Australia's capital cities. The top 10 were:
Accessibility statement: We are committed to providing information and services to the widest possible audience. We’ve designed this website to comply with the Australian Government Digital Service Standard and aim to meet the latest WCAG Guidelines which describe how to make web content more usable and accessible for everyone. However, some functions of this interactive map may be inaccessible, or difficult to use with assistive technology. All data underlying this map can be downloaded in table format from the Data downloads section of this publication. For further information or assistance, or to advise of accessibility issues with this product, please email client.services@abs.gov.au.
This interactive map displays the percentage population change in Local Government Areas (LGAs) between 2023 and 2024. Percentage of population change is divided into 5 data classes:
The top 10 growth LGAs are also displayed with blue dots.
This map shows that the LGAs with the highest population growth rates in 2023-24 were generally either located in Australia's inner-cities or on the outskirts of the country's capitals.
Inner city LGAs in the top 10 included:
LGAs on the outskirts or just outside of the country’s capitals to make the top 10 were:
Accessibility statement: We are committed to providing information and services to the widest possible audience. We’ve designed this website to comply with the Australian Government Digital Service Standard and aim to meet the latest WCAG Guidelines which describe how to make web content more usable and accessible for everyone. However, some functions of this interactive map may be inaccessible, or difficult to use with assistive technology. All data underlying this map can be downloaded in table format from the Data downloads section of this publication. For further information or assistance, or to advise of accessibility issues with this product, please email client.services@abs.gov.au.
The population change map uses Statistical Area Level 2 (SA2) and 2024 Local Government Area (LGA) boundaries according to the Australian Statistical Geography Standard (ASGS) Edition 3.
The population grid map uses a 1km x 1km grid for all of Australia based on the National Nested Grid Standard.
Caution: Data Explorer can be problematic when trying to view and manipulate large datasets, such as SA2-based or LGA geographies released in this product. Please use the Excel data cubes provided above for these datasets.
Data in Data Explorer is currently released after the 11:30am release on the ABS website. Please check the reference period when using Data Explorer.
Population estimates and components by SA2 and above, 2022 to 2024
Population estimates and components by LGA, 2022 to 2024
Population estimates by SA2 and above, 2001 to 2024
Population estimates by LGA, 2001 to 2024
Regional internal migration estimates by region of arrival and departure, SA4 and above, 2021-22 to 2023-24
For information on Data Explorer and how it works, see the Data Explorer user guide.
07/04/25 - The Australian population grid 2024 in ESRI Grid format has been replaced. The previous version was incomplete.
This release previously used catalogue number 3218.0.